DeepSight
Real-time system monitoring, process forensics, and SIEM-level threat detection — across every Linux host in your fleet.
DeepSight is a lightweight, self-hosted dashboard that gives you deep visibility into your servers. Monitor RAM, CPU, GPU, disk, and network usage in real time. Drill into individual processes with forensic detail. Track logged-in users and outbound HTTP connections. Deploy agents to remote Linux hosts with a single curl command.
Why DeepSight?
Most system monitors show you pretty graphs and stop there. DeepSight goes deeper:
- 🕵️ Process forensics — click any process to see its full command line, memory map (PSS/USS/RSS), open file descriptors, child processes, environment variables, and network connections
- 📡 Multi-host — deploy a lightweight Python agent to any Linux box and it reports back to your dashboard
- 🔒 SIEM detection — real-time threat detection: reverse shells, C2 beaconing, SSH brute force, DNS/DGA, file integrity monitoring
- 🌐 Network visibility — see every outbound HTTP/HTTPS connection with reverse DNS and owning process
- 🎮 GPU monitoring — VRAM, utilization, temperature, clock speeds, power draw
- 📦 Zero dependencies on agents — the agent works with just Python 3, no pip packages required
- 🎨 Dark, responsive UI — built for production, looks great on desktop and mobile
Quick Start
git clone https://github.com/R3dy/DeepSight.git
cd DeepSight
pip install flask psutil
python3 server.pyThen open http://localhost:8451 in your browser. That's it.
Getting Started → for Tailscale setup, remote agents, and troubleshooting.
What You'll See
| Widget | Data |
|---|---|
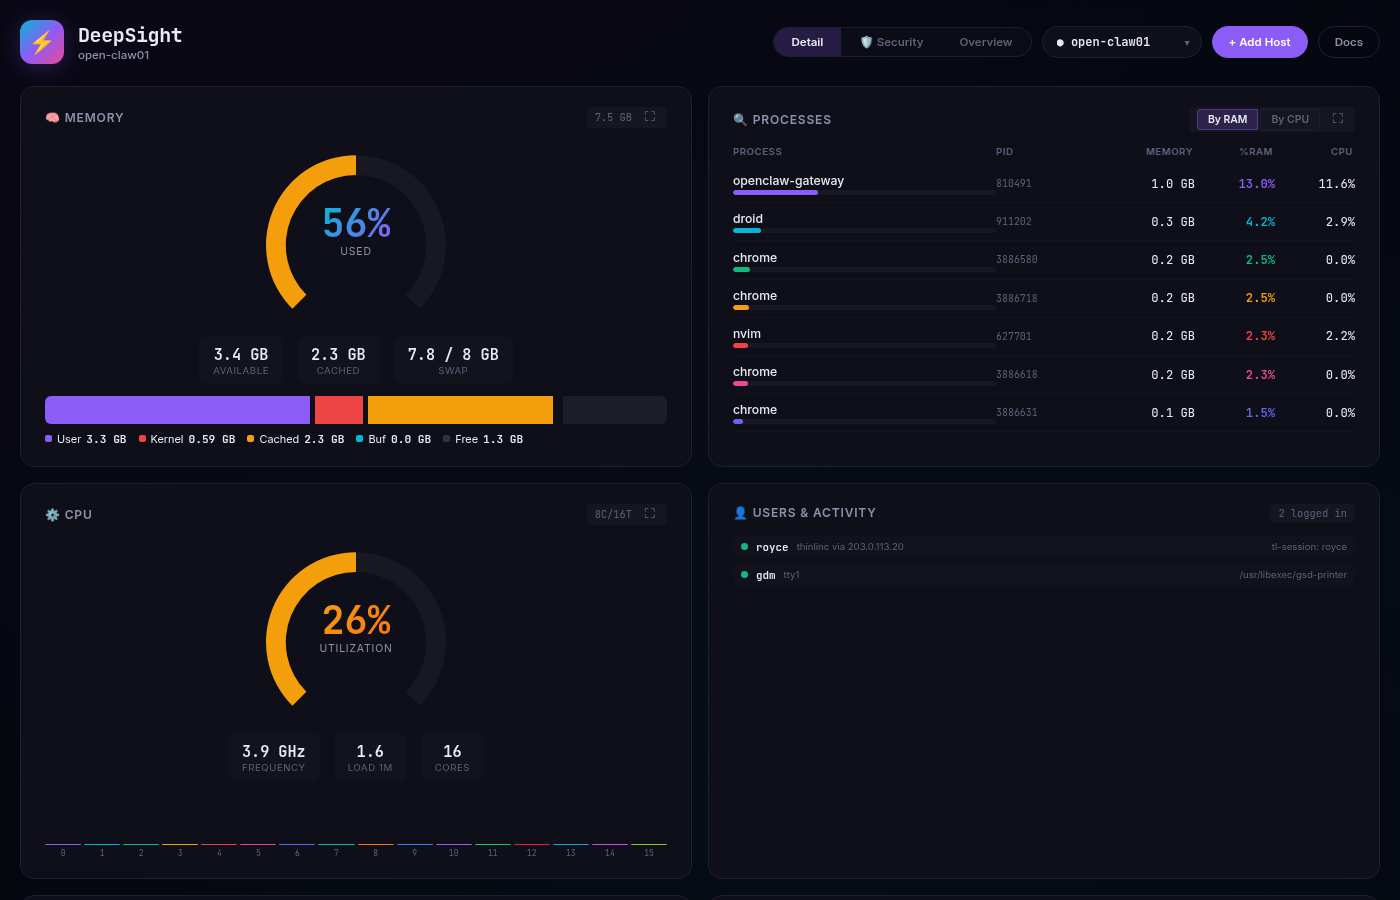
| 🧠 Memory | User, Kernel, Cached, Buffers, Free breakdown with PSI pressure |
| ⚙️ CPU | Per-core utilization, freq, temp, context switches, load averages |
| 💾 Disk | Usage bars, I/O throughput, IOPS, inode usage per volume |
| 🎮 GPU | VRAM, utilization, temperature, clock speeds, power draw |
| 🔍 Processes | Tabbed RAM/CPU tables, sortable columns, click-to-forensics |
| 👤 Users | Logged-in sessions with activity and source IP |
| 🌐 Network | TCP listeners, outbound HTTP connections with reverse DNS |
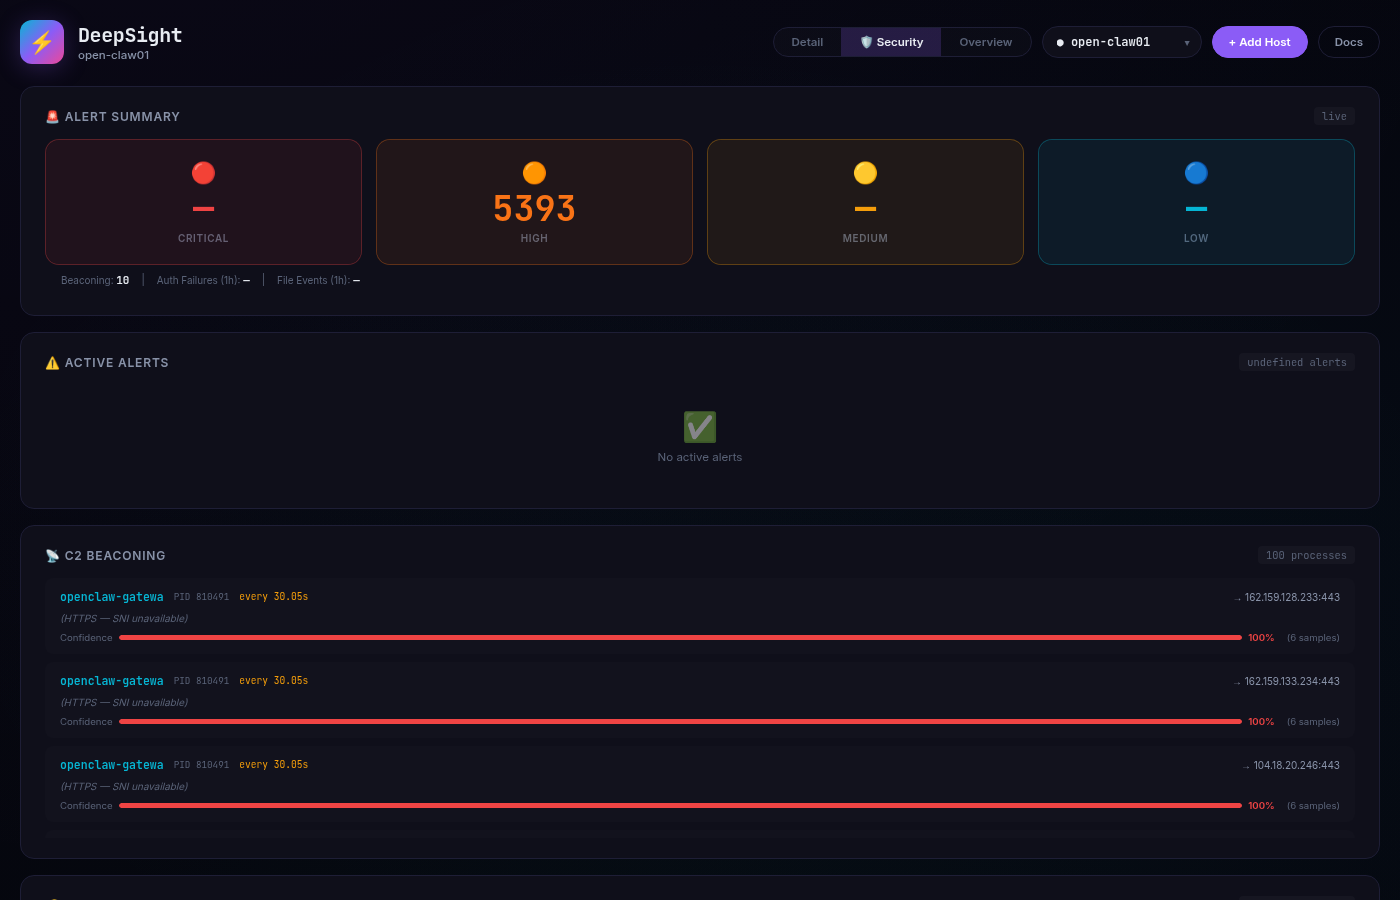
| 🛡️ Security | Active alerts, C2 beaconing, auth events, file integrity monitoring |
Security Detection
DeepSight includes a built-in SIEM engine that continuously scans your systems:
| Detector | What It Catches |
|---|---|
| Process Auditor | Reverse shells, webshells, hidden cmdlines, executables from /tmp |
| C2 Beaconing | Periodic outbound HTTP patterns with confidence scoring |
| Auth Monitor | SSH brute force, sudo/su usage, account creation |
| DNS Analyzer | DGA domains via Shannon entropy scoring |
| File Integrity | Real-time monitoring of critical system files |
Every alert is tagged with MITRE ATT&CK technique mappings and severity levels.
A Note on How This Was Built
DeepSight was vibe-coded with AI assistance — a human describing what they wanted, an AI writing the code, and a lot of back-and-forth iteration. That means some things might be a little quirky. Bugs are features waiting to be discovered. If you find something that doesn't work quite right, or if you think something could be better:
- Open an issue
- Submit a PR
- Come hang out on Discord
This is community software. It's free, it's open source, and it gets better every time someone like you jumps in to help.
docs/public/screenshots/ and rebuild with npm run docs:build.