Dashboard UI
A tour of every widget on the DeepSight dashboard — what it shows and how to use it.
Views
DeepSight has two views, accessible via the Detail / Overview tabs in the header.
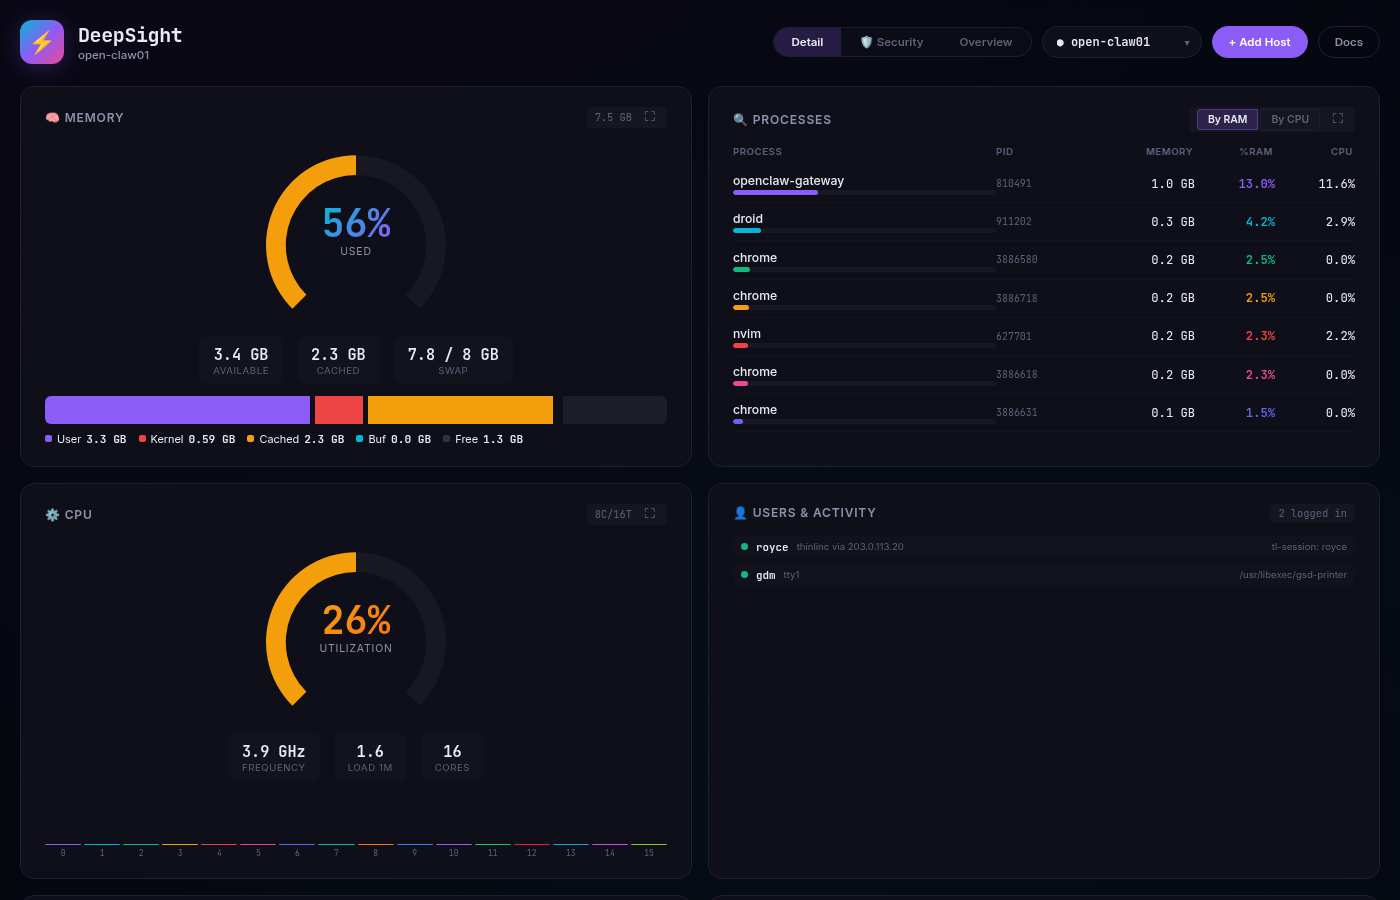
Detail View
Shows deep data for a single host. Use the host dropdown to switch between reporting machines.
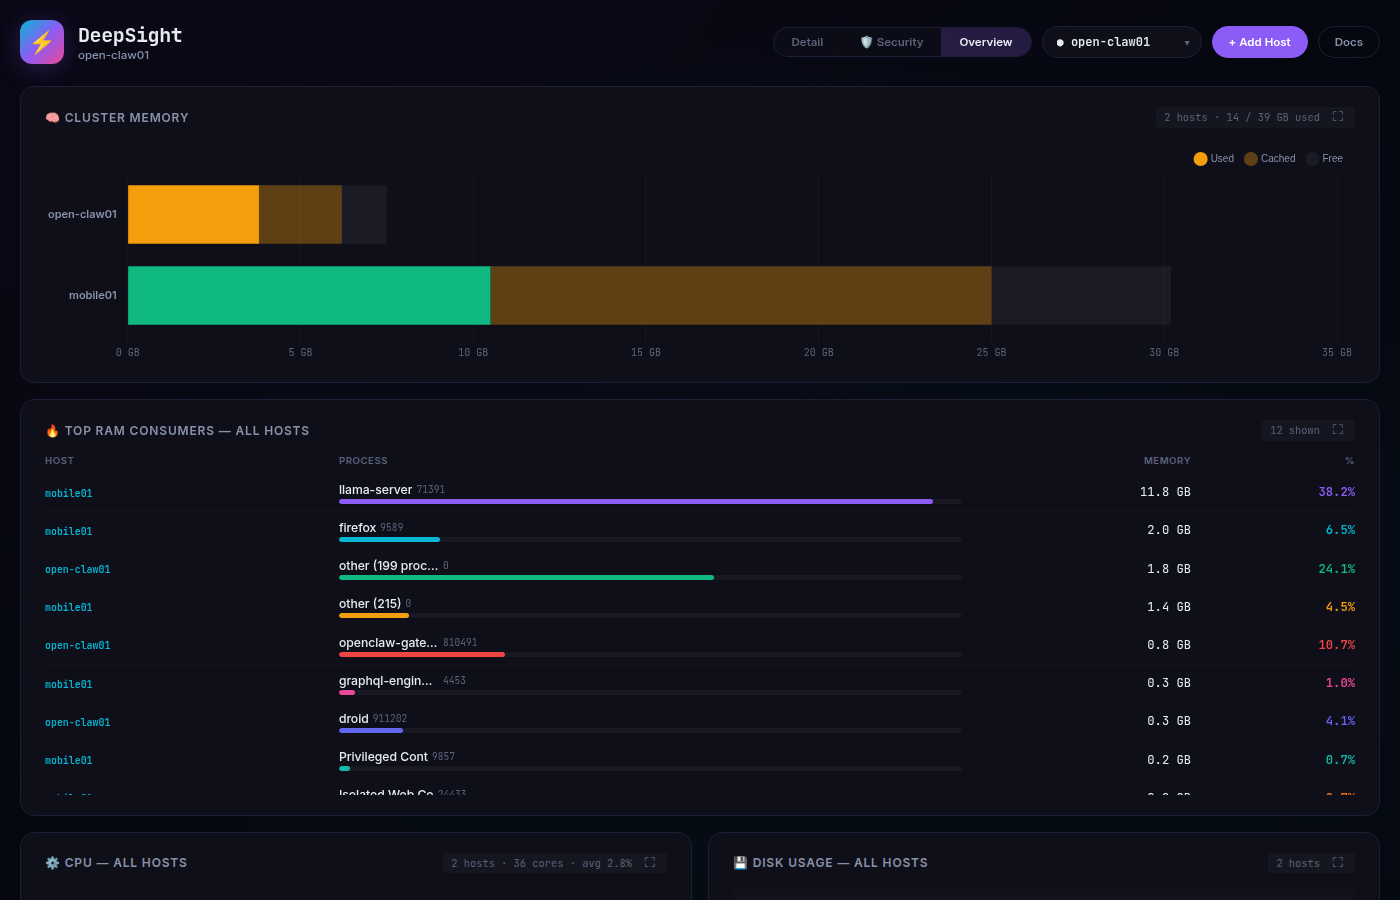
Overview View
Cluster-wide charts comparing all hosts side by side.
Widgets
🧠 Memory
Shows total RAM usage as a donut gauge with a five-segment breakdown bar:
| Segment | Color | Meaning |
|---|---|---|
| User | Violet | Memory committed by your applications |
| Kernel | Red | Unreclaimable kernel memory — can't be freed |
| Cached | Yellow | Page cache — reclaimable if needed |
| Buffers | Cyan | Filesystem buffer cache |
| Free | Dark | Completely unused |
Expand (⛶): Deep dive shows all /proc/meminfo fields (Active, Inactive, AnonPages, Shmem, Slab, KernelStack, PageTables, Dirty, Writeback, Committed), PSI memory pressure metrics, swappiness, and per-process PSS/USS (more accurate than RSS).
🔍 Processes
A tabbed widget showing the top memory consumers (By RAM) or CPU consumers (By CPU). Click column headers to sort ascending/descending. Click any process row to open a forensic detail card showing:
- Full command line with arguments
- Memory map: RSS, PSS, USS, VSS, Data, Stack, Exe, Libs
- Runtime: threads, CPU user/system time, voluntary/involuntary context switches
- Open file descriptors (count + sample)
- Network connections owned by the process
- Child processes
- Environment variables
Hover any process row for a quick summary tooltip.
Expand (⛶): Full process list with all columns — PID, user, state, threads, PSS, RSS, USS, CPU%, user CPU time, system CPU time.
⚙️ CPU
Total CPU utilization gauge, per-core heatmap bars, frequency, temperature, context switches/sec, and load averages (1m/5m/15m).
Expand (⛶): /proc/stat time breakdown — user, system, iowait, irq, softirq, steal, idle, nice — with inline bars. Full per-core grid with individual percentages. System uptime.
💾 Disk
Usage bars for every mounted volume, color-coded by fill level.
Expand (⛶): Per-volume details including filesystem type, device path, I/O throughput (read/write MB/s), IOPS, inode usage percentage, and cumulative read/write totals.
🎮 GPU
VRAM donut gauge, utilization percentage, and key stats.
Expand (⛶): Temperature, power draw (W), GPU clock (SCLK), memory clock (MCLK), detailed VRAM breakdown.
👤 Users & Activity
Logged-in users with session details from the w command — username, terminal, source IP, idle time, and current foreground process.
🌐 Network
Split into two sections:
| Section | Shows |
|---|---|
| Outbound HTTP | Process → target URL for connections to ports 80/443/8080/8443, with reverse DNS |
| TCP Listeners | Listening ports with owning process and PID |
Hover or click any connection's process name to jump to that process's forensic card.
Expand (⛶): Full network deep dive — interface RX/TX stats, all TCP connections with state, all UDP listeners, DNS query count and cache size.
🛡️ Security View
Access the Security view from the 🛡️ Security tab in the header. This view surfaces real-time threat detection data from every host in your fleet.
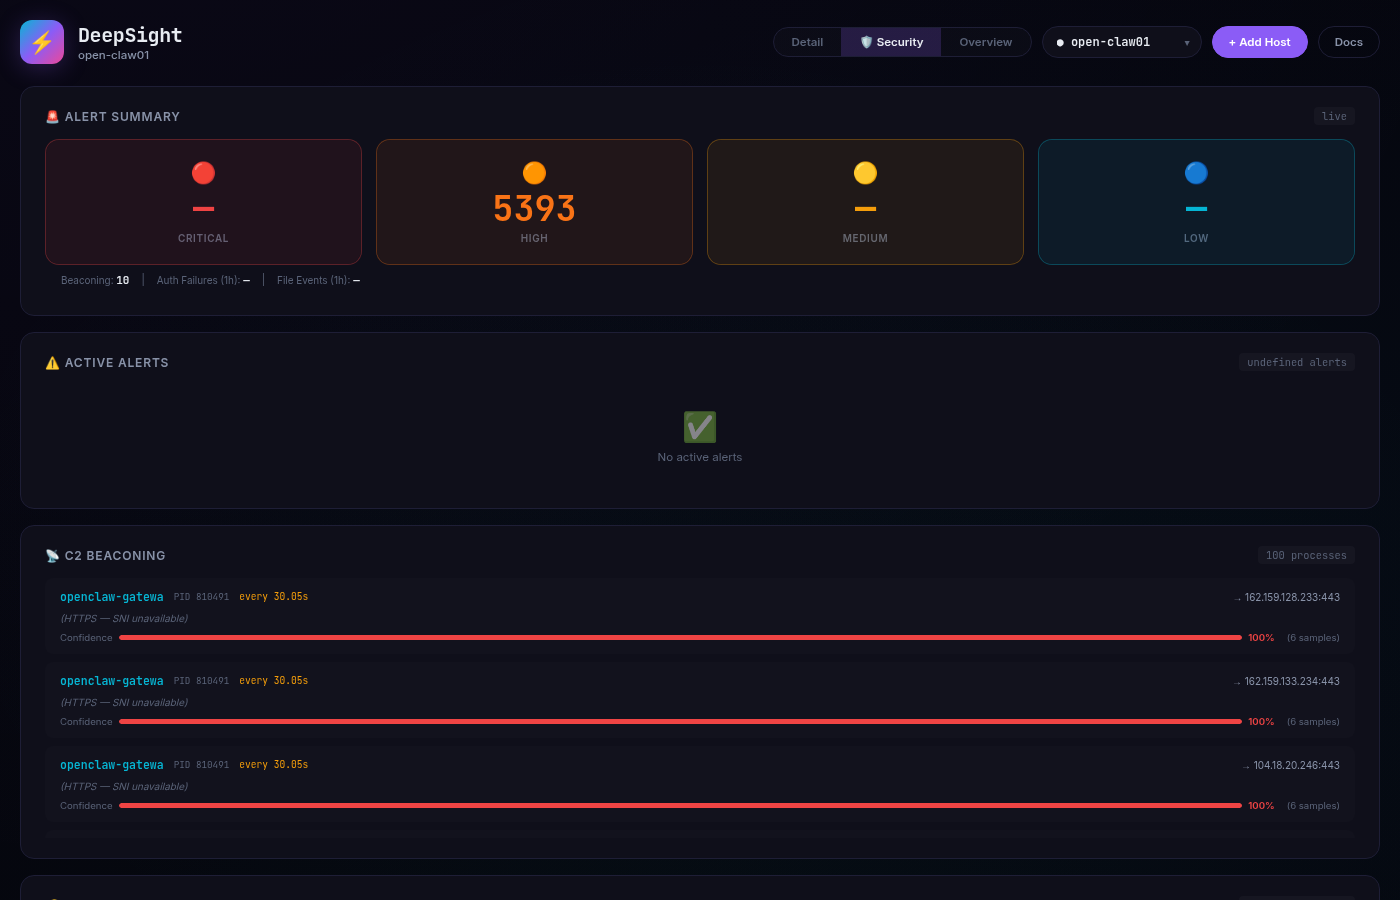
Alert Summary
A donut gauge showing alert counts broken down by severity — Critical, High, Medium, Low, and Info — over the last 24 hours. Click any severity segment to filter the Active Alerts feed below.
Active Alerts
A chronological feed of all open alerts. Each alert shows:
- Severity badge (color-coded: red critical, orange high, yellow medium, blue info)
- Rule name and host where the alert fired
- Timestamp with relative time ("2m ago")
- Acknowledge button (✓) — dismiss alerts you've triaged
Click any alert row to expand a detail card with full forensic context: the triggering process tree, network connection details, relevant file diffs, or DNS query patterns.
C2 Beaconing
Lists process-to-destination pairs with detected periodic callback patterns. Each row displays:
| Column | Description |
|---|---|
| Process | Name and PID of the beaconing process |
| Destination | IP:port or hostname being contacted |
| Interval | Detected callback interval (e.g., "30s") |
| Confidence | 0–100 score with color bar |
| First Seen | When the pattern was first observed |
High-confidence beacons (>70) are highlighted in the dashboard.
Auth Events
A filterable table of recent authentication events:
- SSH failures — failed login attempts with source IP and attempted username
- SSH successes — accepted logins with session details
- sudo usage — command, invoking user, and target user
- su transitions — user switching events
Use the type filter to focus on brute force attempts, privilege escalations, or new sessions.
File Integrity
Shows recent file change events from watched paths. Each event includes:
- Path — the modified file
- Change type — created, modified, deleted, permission, or ownership
- Before/after — checksum or mode comparison where available
- Timestamp — when the change was detected
Critical paths
Changes to /etc/sudoers, /etc/shadow, or authorized_keys are highlighted in red with an exclamation marker. These warrant immediate investigation.
Sorting & Interaction
- Sort columns — click any table header (▲/▼ indicator appears)
- Hover tooltips — hover any process row or network connection for a quick detail card
- Click to drill down — click a process row for the full forensic modal
- Expand (⛶) — every widget has a deep-dive button for additional detail
- ESC — close any modal or tooltip
See the Security Monitoring page for full detection rules, MITRE mappings, and alert configuration.